North San Francisco Bay
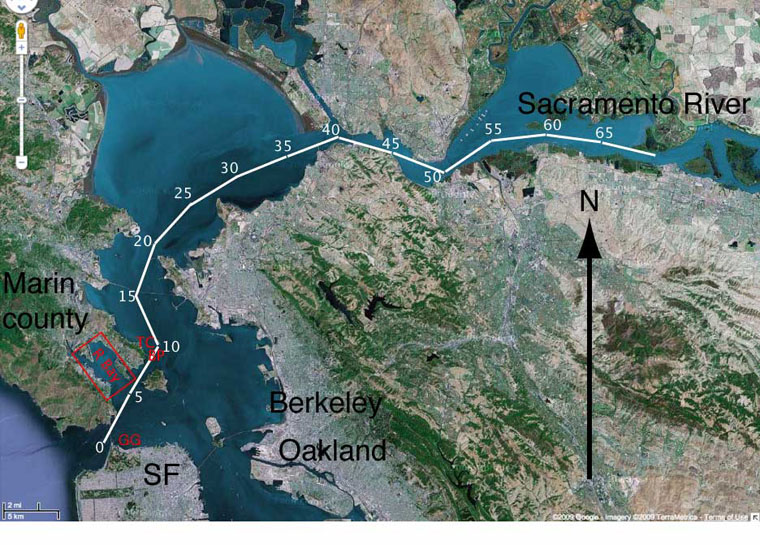
San Francisco Bay can be divided into North, Central, and South regions. The Sacramento River, which delivers the great majority of fresh water to the San Francisco Bay estuary, flows South West through the North region of the Bay in a channel typically 20 m deep. This channel is indicated by the segmented white line in the map below [Google Maps], with distances from GG indicated in km. Tidal currents extend at least 60 km up from the GG, as the water in these regions is brackish. The Central and Southern regions of the Bay are not directly involved in major flows of fresh water.
The Romberg-Tiburon Center (red TC on map below, just to left of the white "10") is on the channel that transports river water out to the ocean. Tidal current predictions by NOAA are available for a location 200 m off Bluff Point (red BP on map). Information from sensors at the end of pier extending from the Romberg-Tiburon Center are available on the Internet as part of the NOAA National Data Buoy System. Richardson Bay (red rectangle R Bay on map) is the location for studies in the second part of this poster.
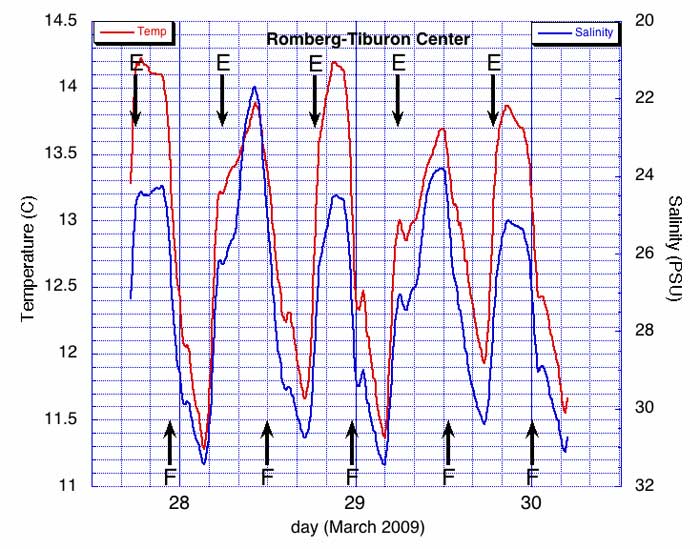
Temperature and salinity versus time at the R-T Dock
Surface water temperature increases when the ebb tides (E- arrows) brings warm, low-salinity water, and decreases when the flood tides (F-arrows) brings cold salty water past the dock. The temperature curves are complex, but the fact that they mirror salinity (note inverse scale for salinity) indicates that they reflect the real composition of the water. The shape of the flood curves is different from the ebb curves, which is possible because flow is dominated by inertial forces (high Reynolds number), and thus water “remembers” where it came from. Since the flood and ebb paths can be different, temperature and salinity curves can be different.
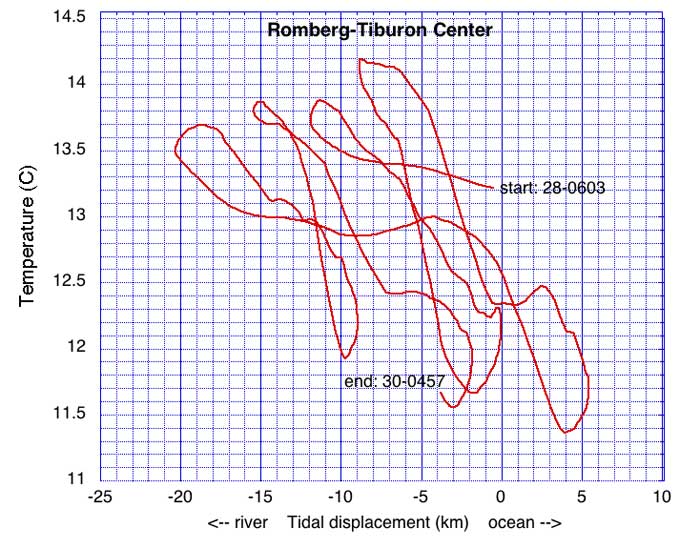
Temperature versus position on the water
At each 6 minute temperature value (previous Figure) I have calculated the position on the sheet of water moving past the R-T dock using the NOAA current predictions for Bluff Point (BP on map), thus integrating current velocity to get position. In the most simple case the temperature-distance curves for each tidal cycle would be almost superimposable, because they would represent the temperature gradient along the water.
The previous Figure shows the temperature-time profiles to have a complex shape. However, NOAA current predictions consist of a best fit of observed values to a smooth sinusoidal curve. The tidal flow pattern past the dock could be complex, and if we knew that pattern and used it to obtain water positions the temperature curves would be simplified. However, if the flows are complex, the temperature profile in the water would also likely be complex.