Richardson Bay
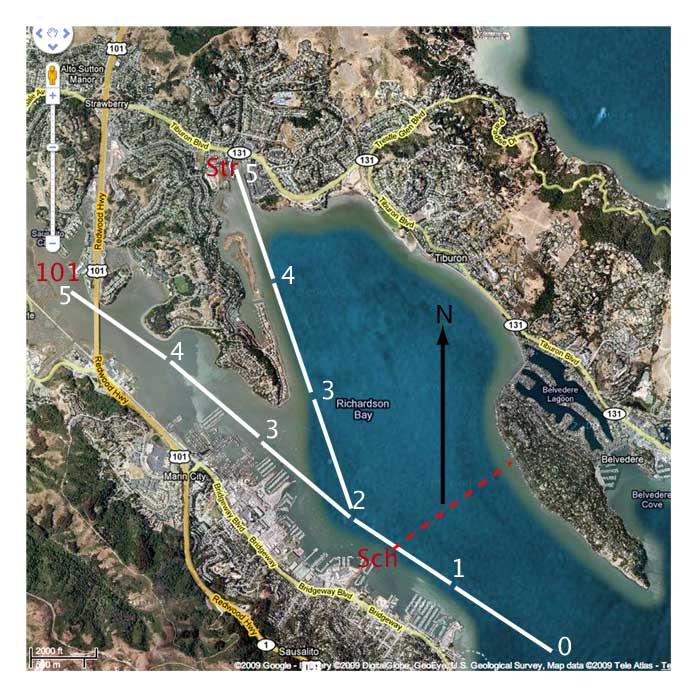
Richardson Bay, a small (2 x 5 km) extension of San Francisco Bay, extends North from the 20-30 m deep channel that runs from the Golden Gate Bridge to the Sacramento River. The entrance to Richardson Bay is the top of an underwater cliff that drops down to the bottom of this channel. A channel for small boats, dredged to 8 m, runs along the SW edge of the bay past the town of Sausalito. This channel, and two shallow extensions, are indicated on the map at the right as white dashes with kilometer labels. The Northern extension ends at a floating dock labeled Str (Strawberry), and the Western extension becomes narrow at a floating dock labeled 101 (past the 101 overpass). The extensions branch from the main channel at a floating dock labeled Sch (Schoonmaker) and the width of the bay there is indicated by a red dashed line.
The bottom of Richardson Bay slopes from a depth of 5 m at the entrance to 0 at the NW end. A significant fraction of the Bay become mud flats at low tides. Clumps of eelgrass (Zostera sp.) fill much of the shallow end of the bay. The shallow water and eelgrass probably result in a Reynolds number below 106, so flow might well be laminar in much of the Bay. The time required for the tidal wave to move from entrance to end would be only 10 to 30 minutes for depths of 9 to 1 m. Thus, currents should closely follow changes in tidal heights.
Rain falling on the East slopes of Mt. Tamalpais in winter flows into Richardson Bay, producing a marked salinity gradient. Thus, Richardson Bay is an estuary within an estuary.
What water temperatures should we expect in shallow water?
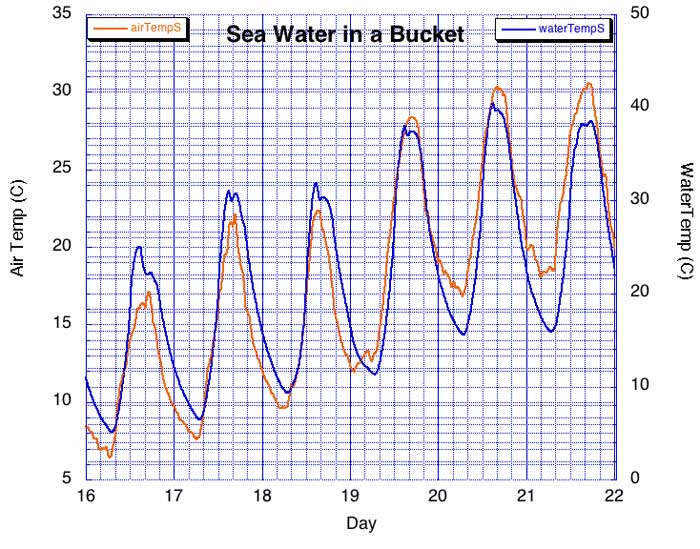
A 5 gal plastic bucket filled with sea water to a depth of 0.4 m was exposed to full sun and wind near the shore of Richardson Bay. One temperature logger in the water, and another in air produced the data shown above. The maximum water temperature exceeds air temperature, thus direct solar heating is a major energy input. The maximum temperature occurs at about 1500, not 1200 hours. One hour difference is due to daylight savings time, the rest intrinsic thermal inertia.
What water currents should we expect?
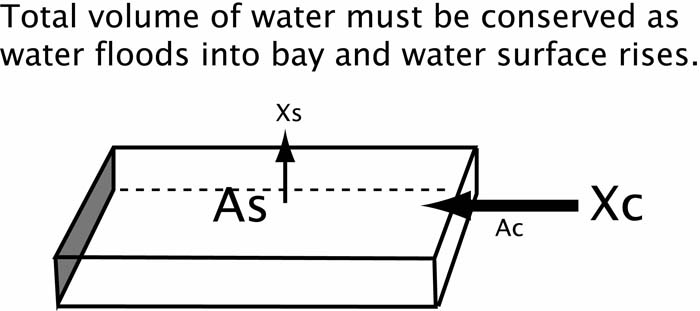
Richardson Bay is small, and tidal flows should be close to static equilibrium. In this case the product of water movement normal to the cross sectional area of the Bay and that area (Xc times Ac), would be equal to the product of vertical displacement of the water surface and that area (Xs times As).
The approximate surface area of Richardson Bay NW of Schoonmaker dock (to the left of the dashed line) is 9X10⁶ m2 and the cross sectional area is 4X10³ m2, thus the ratio is about 2000. A typical tide change of 1.5 m would suggest a 3 km horizontal movement of water. If the depth from start to end of the channel were constant, the water displacement would decrease linearly to 0 along the channel, because the ratio of cross sectional to surface area decreases linearly to 0 over that range. If instead, the depth decreased linearly from the dock to the end of the Bay (which is close to the actual case), velocity remains constant, because the decrease in surface area is matched by a similar decrease in cross sectional area.
Currents measured along the main channel using a drift buoy were greater than 1 knot (0.5 m/s or 2 km/hr) during a flood. Thus we expect water to flow from the entrance of Richardson Bay to the wetlands at its end and back in one tidal cycle.
Daily temperature range increases from GG Bridge to shallow wetlands
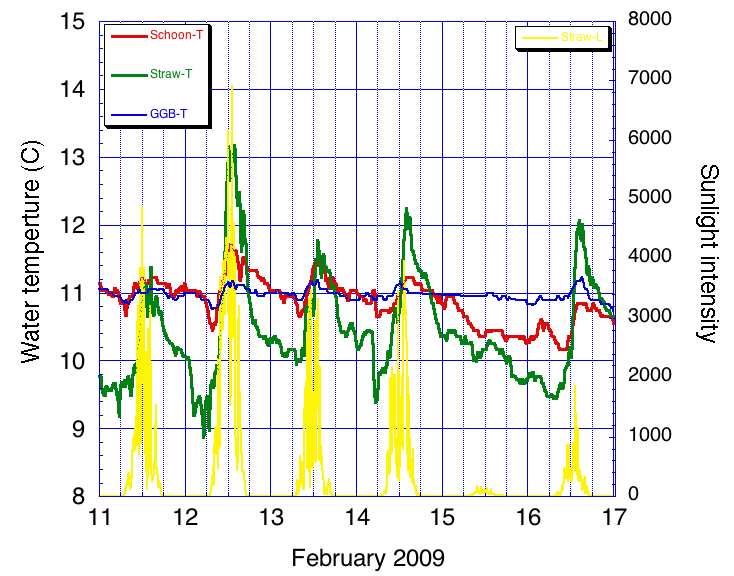
During February the daytime air temperatures were colder than the water, and there was no sun on the 15th. The temperature range is the greatest in the shallow water around Strawberry dock, intermediate at Schoonmaker, and least at the GG Bridge. The main temperature peak in shallow water is shortly after noon, but there is a hint of a shoulder around midnight. Heating depends on solar input, as evidenced by the data on the 15th. Salinity at Schoonmaker on the 17th was 30 (ocean water is 35) while salinity at Strawberry was only 9 because of recent rains.
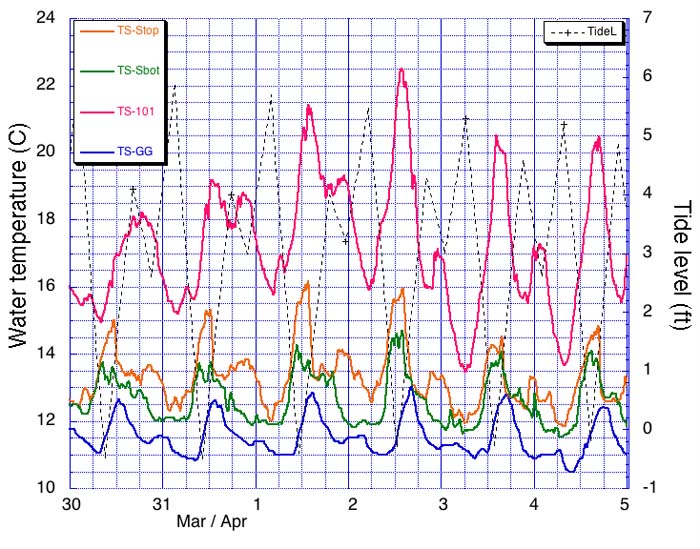
Water temperature determined by tide as well as sun
Daytime air temperatures were above water temperatures during this period, and shallow water temperatures were always above those at the GG Bridge. There are two daily temperature maxima, correlated with times of ebb (low water).
Deep water at Schoonmaker dock is always colder than the surface (green vs. orange lines), and the temperature peak near midnight is often absent in deep water. I propose the midnight peak in surface temperature is due to heat stored in the mud flats at the end of the Bay, and that the warmer water ebbing at night floats over colder, deeper water. The ebb current at night is less than the corresponding daytime current (for this period), which would result in less mixing between surface and deeper water. There were no recent rains, and surface water salinity at Schoonmaker and 101 were 29 and 26, thus temperature determined density here.