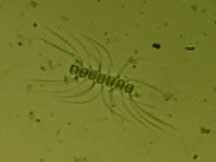
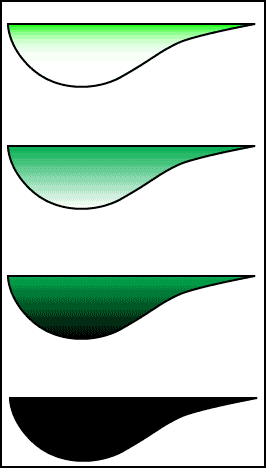
A food chain is a description of who eats who or what
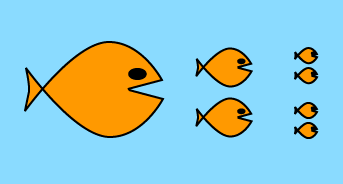
In the picture on the left the who's are fish, and the rule that defines the food chain is that big fish eat little fish. Simple as it is, this is a good general rule.
Why should we care about food chains (unless we are biologists that are just curious)? Humans are animals that eat other animals. When the population of an animal that we like to eat (like salmon) decreases there can be several reasons: someone else is eating our salmon or the salmon can't find the food they normally eat. If we know who eats salmon, what salmon eat, and what those animals eat, maybe we can correct the situation and put more fish on our table. |
||
A real food chain
The top four layers of this food chain (top means the largest animal) are:
Layer 1: Bear A large mammal that catches spawning fish in shallow rivers. length: 2 m (6 ft) |
|||||||||
Layer 2: Salmon A fish that hatches in a river, matures in the ocean, and returns to the same river to spawn and be eaten by bears. length: 0.8 m |
|||||||||
Layer 3: Herring An ocean fish similar to the sardine and a favorite food of the salmon. length: 0.1 m |
|||||||||
Layer 4: Copepod A small crustacean eaten by herring whenever they can catch them. length: 2 mm |
|||||||||
If you look at the sizes of the individual animals, as in the previous section, the food chain looks like an upside-down pyramid (red) resting on its point. However, if you look at the number and total mass of animals in each layer of the food chain it looks like a right-side-up pyramid (blue): number and total mass of animals increase as you go from top to bottom of the chain. |
||||||||||||||||||||||||||
When one animal eats another the eater (predator) gets bigger and the eaten (prey) appears to disappear. It may just seem like a one-for-one conversion, but it is not an even trade. Much of the prey can't be digested, e.g. bones and cartilage. Another portion of the prey is converted into energy to enable the predator to move around and eat more prey. Another portion of the prey is converted to heat. As a result of this low "efficiency" of conversion the total mass in each level of a food chain must increase as you go from top to bottom. Since the size of animals generally decreases as you go from top to bottom of the food chain, the number of animals increases even faster than the total mass.
The result of these factors is that the food chain is a pyramid: a small number of large animals at the top and a much larger number of small animals at the bottom. The numbers assuming a 5 percent efficiency for each layer are given in the table below. The real world is more complicated, the bear lives on more than salmon alone, and the effeciency is most likely different for each layer. However, the take home lesson is that the total mass of organisms in each layer of a food chain gets larger as you go toward the bottom. In the following table total mass required for each layer increases 20 fold for each layer (5 percent effeciency), and the total numbers are then the mass divided by the mass per organism. |
||||||||||||||||||||||||||
|
||||||||||||||||||||||||||
This example of a food chain suggests that individual prey are smaller, but not too much smaller, than the predator. This is typically true, but need not be. Manta rays, fish that exceed a hundred kg in weight, eat copepods that weigh about a mg:
www.mantapacific.org/mantapacific/information/feeding.html In this case the ratio in weight is: 100,000 / 0.001 or 100,000,000 = 108 Some whales eat krill, a small shrimp-like animal, and the ratio in weight is almost as large. |
||||||||||||||||||||||||||
The bottom of this food pyramid
At the bottom this food pyramid splits into two arms, A and B, and connects the living to the non-living world.
A |
This is a composite layer since Copepods eat both
<=== dinoflagellates (left) and diatoms (right). ===> In fact, there is evidence that a mixture is required for good copepod health [Science v307p1457(2005)]. |
B | |||||||||||
Dinoflagellates (dancing flagellates) have two flagella which beat at right angles to each other, although only one is visible in this picture (the curved line coming down and left from the large spot). The many different species have different shapes and sizes, this one is about 0.15 mm in diameter). They enjoy eating bacteria. | Diatoms are plants, and thus the end of this arm of the food pyramid since they don't eat living organisms. Instead they use energy from the sun and make sugar from CO2 and water (photosynthesis). They come in a huge variety of shapes and sizes (this one is 0.15 mm long). | ||||||||||||
Bacteria (typically 0.006-0.001 mm long) are the end of this arm of the food chain since they don't eat living organisms. Instead they take up organic molecules (sugars, amino acids, fats, etc.) from their environment. They oxidize some of these molecules to generate energy, using oxygen from the atmosphere. The remaining molecules are converted into the components of the bacterial cell enabling it to grow and multiply. | |||||||||||||
The food chain as a cone in space-time
The food pyramid described above is actually just a flat triangle, but the animals at each layer have a life independent of eating and being eaten. For example, the copepods in layer 4 are born, grow, mate, produce baby copepods and die even as they are eating from the layer below and being eaten by the layer above. | ||||||
Copepods are crustaceans (members of the arthropod phyla, the group that includes insects) and they have a hard shell (exoskeleton) instead of the internal network of bones that humans have. They grow by periodically molting: splitting and shedding their shell, and then growing a new larger one.
Copepods are released as eggs from the mother and then go through 11 molts. Copepods in the first 6 stages are called nauplii, and in the next 4 stages copepodids. The first naupli has only 3 sets of legs and typically does not eat. The biggest change in morphology occurs between the last naupli and the first copepodid. Subsequent molts add segments at the end of the animal to finally produce the adult (the Figure below does not explicitly contain all these stages). The average time between molts is about 2 days, thus the total time between fertilization and adult is 30 days. In the laboratory the adult can live 30-60 days, but in the wild the adults typically live only a few days before being eaten. |
||||||
On the left we are looking down the food cone at a slice through the copepod level. Time is indicated by rotation, like the hands of a clock.
Animals that eat copepods (herring) are in an upper (darker) slice through the cone. In a sense the copepods are falling into a darker hole when they are eaten. Animals (dinoflagellates) and plants (diatoms) eaten by copepods are on a lower (lighter) slice through the cone. These organisms are falling into a darker hole when they are eaten. |
||||||
The real food cone is very complex. Here we see just a cohort of copepods, but in the real world at any time there are animals present at all stages of development. Animals that prefer the small eggs of copepods may not be able to eat the large adults. Other predators wouldn't bother to eat an egg, but do eat large adults. A small nauplii may not be able to eat a larger dinoflagellate, but rather feeds on small aggregates of bacteria. Finally, most animals are occasionally cannibals, and adult copepods do eat copepod eggs and small nauplii. This would be represented by a food arrow in the plane of this diagram.
Thus the concept of a food cone is not just a gimmick to illustrate the life cycle of the copepod. Rather, copepod as predator or prey is the time average of its forms, and in the ocean, most copepod are juvenile. |
||||||
The food chain as a web of organisms and molecules
Much of the material that flows between layers of food chains is not the whos that eat or are eaten but molecules, too small to be seen, even in a microscope. The cartoon below shows some of the major exchanges between the three classes of organisms.
Animals and bacteria need oxygen, which they can get from the atmosphere or from plants. They produce carbon dioxide. Plants need carbon dioxide, which they can get from the atmosphere or from animals and bacteria. In the absence of oxygen some bacteria obtain the equivalent from sulfur containing compounds, and they then produce hydrogen sulfide. Bacteria are the most versatile metabolic machine, and exploit many variations on these metabolic themes. |
|||||
The feces of animals (the brown arrow) contains a mixture of dissolved (soluble) organic compounds that are taken up by bacteria. Feces also contains a great deal of particulate organic matter (not indicated here) which is eaten by other animals as it slowly settles to the bottom of the water.
Feces also contains dissolved inorganic material (the blue arrow), especially phosphorous and iron, which are often the limiting material for plants trying to grow in the ocean. Bacteria can also take up dissolved inorganic material, but often the organic material already provides all they need. Of course, when any of these organisms die they decompose and release both organic and inorganic material which is then used by the living organisms. Everything is recycled in the living world. |
|||||
The sizes of the square, rounded square, and oval don't represent the sizes of the organisms but rather the total mass of each class. However, the differences in total mass are much greater than indicated by the differences in sizes of the objects in the Figure. | |||||
The ecological niche
A bio-web is constrained and defined not only by its population of living organisms but also by its physical, geographical, and metrological conditions. The combination of all these factors constitute the effective environment for the organisms.
The complete environment for one species is called an ecological niche. In one geographical location there are typically many ecological niches. As an example, in shallow water some organisms may float close to the surface, some may swim throughout the water, some may live in the bottom mud, some may live on the surface of seaweed, some will be a parasite of another species, etc. In addition, for each of these micro-environments different species will generally eat different items, and thus occupy different niches. Thus, both the location and the behavior of a species defines the niche it occupies. |
||||||
So far this may just seem to be a definition of terms, there is no real insight. It doesn't seem controversial or even testable (a result of lack of content).
However, now we claim that niches are discrete, and generally only one species occupies one niche. In fact you could say that the species defines the niche. However, it could be claimed that the niche defines a species. This is actually a deep and important topic, but too large to explore here. |
||||||
The coordinates of ecological niche space represent the variables that define niches: location, food, predators, temperature, sunlight, etc. Three niches are shown symbolically above. | ||||||
Changes over time in the bio-web
Time sequential cross sections of a lake as the distribution of plants and bacteria change.
Green areas indicate living plants while black indicate anaerobic (non-oxygen requiring) bacteria. |
||||||||
Most bio-webs change over time, if for no other reason than the annual seasons constitute changes in sunlight, temperature, and rainfall. However, dramatic changes in bio-webs can also be the results of human activities. There are literally thousands of documented cases, but here is a frequent scenario.
A lake has plants concentrated at the surface where the light intensity is highest. The concentration of plants is limited by the concentration of phosphate. The plants release oxygen into the water which supports a large collection of animals and bacteria. Phosphates are added to the lake by human activities. It could be fertilizer runoff or sewage effluent. At first the density of plants increases, but plants become so concentrated that sunlight is blocked for the plants toward the bottom. These plants then start to die and provide food for bacteria that consume oxygen. The oxygen concentration falls (there are no living plants to produce oxygen) and then animals also die. The dead animals provide food for bacterial that consume the little remaining oxygen. Eventually the only organisms alive are anaerobic bacteria, which do not require oxygen (black). These bacterial produce hydrogen sulfide, the gas also produced by rotting eggs. One might be tempted to call this a sick lake. This would be anthropocentric; the lake just contains a different spectrum of living organisms. However, humans would find it unpleasant, and the total mass of living organisms is lower, thus the "sick lake" label. |
||||||||
A recent report on this kind of process is: "Gulf's Dead Zone Worse in Recent Decades", Science vol 308, pg 195 (2005) [not available on line].
"Climate Impact on Plankton Ecosystems in the Northeast Atlantic" in Science vol 305, pg 1609 (2004) [abstract] is one (of many) accounts of the effects of global warming on the oceans plankton. |
||||||||
Recent research reports on food chains