Pharmacokinetics
Pharmacokinetics is the measurement and interpretation of concentrations of drugs in the body. Drug concentrations are usually measured in the blood, although occasionally other body fluids are sampled. The experimental branch of pharmacokinetics consists of methods to measure drug concentrations. HPLC is now a common method, although many others are used. However, concentrations alone, for example those on the left seen after oral administration of two drug formulations, are raw data that beg further questions: 1. Why do the levels rise to a peak and then fall? |
||||
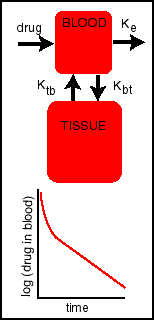
In order for drug concentration measurements to have maximal impact on drug development and clinical practice, it is necessary to have simple models for drug transport and elimination. Pharmacokinetic models are built out of pools. A pool is a compartment in which mixing or diffusion is rapid enough so that the distribution of drug throughout that pool is essentially uniform. Pool models are used for many purposes, e.g. radioisotope labeling. In one pool a single number represents concentration at a given time. The pool in a pharmacokinetic model may have a clear anatomical identity, e.g. the blood. However, a pool can also represent a diverse collection of tissues that are combined into one model pool with an average drug concentration. This is done when the accuracy of the data and the needs of the analysis don't require a more detailed model. A model consists of a network of pools (the red squares on the right) with drug transported into, out of, and between them (the arrows). Transport and elimination is usually assumed to be first order in concentration, i.e. a constant percent per unit time. Thus the rate constants, Ks in the figure, have units of 1/time. The two compartment model on the right is often used for bolus IV administration. At t=0 the concentration in the blood is maximal. Drug is then lost through elimination (usually by the kidneys) and passes into the interstitial fluid in the other tissues of the body. As the concentration in the tissue pool increases, more drug is transported back into the blood. The return of drug to the blood causes the rate of decrease in the blood to slow, and thus the slope of the curve is less. Thus we see a biphasic curve. The equation for drug concentration is the sum of two declining exponential terms. This solution can be obtained by simple algebra, and advanced methods can solve systems of arbitrary complexity. Since solutions of many pool models are sums of exponential terms, semi-log plots are usually used. Then a single exponential term is a straight line, and straight segments mean that one exponential term dominates in that time interval. Thus, if the concentration versus time curve were a straight line in this semi-log plot, it would indicate only one pool, and thus suggest the drug is not transported into tissue. The actual shape of the curve for the IV bolus model depends on the three rate constants (the Ks), and the ratio of volumes of the two pools. This can be explored using a Java calculator. |
|||
Phenomenological constants are those used to fit data, in pharmacokinetics the relative amounts and time constants of exponential terms. You could use exponential terms as purely graphical tools to fit the data, not knowing or caring anything about pool theory. They do a good job of curve fitting, just as the class of polynomials (splines) used in computer graphics programs do a good job of drawing apples. Splines have nothing to do with apples (to my knowledge), and you never actually see the equations anyway. A bonus of using exponential terms to fit pharmacokinetic data, is the ability to directly compute the fundamental or model constants of a pool system. The pharmacokineticist typically starts with drug concentrations at various times, uses a model appropriate for the route of administration, etc., and determines phenomenological constants to obtain a good fit to the data. Computer programs for desktop computers now make this a simple task, although it may take experience and judgment to pick the best model and know how to interpret it (that's why we need the pharmacokineticist). Model free analysis is a misleading term for an alternative approach. In this method you determine the area under the curve, i.e. the integral of concentration over time, which then gives the elimination rate. The area can be determined many ways, with the commonly advocated trapezoid rule usually being the worst. |
||||
Beyond pharmacokinetics Pharmacokinetic theory can sometimes extract considerable information from just the curve of plasma drug concentration versus time. However, it is a tool for looking at the transport of drugs averaged over the whole body and thus gives no insight into the flow of drugs or metabolites in specific tissues. Thus we learn nothing about the relation between cell biology, tissue structure, vascular anatomy and transport. Study of the microcirculation not only reveals the behavior of individual tissues, but allows you to correlate permeability with structure and thus discover the mechanism of transport (see the book section for reviews of this field). Rakesh Jain at the Harvard Medical School has published many innovative studies of microcirculation over more than a decade. A recent publication in PNAS extends his work on transport into and out of tumors, and the references in this article will allow you to trace back the large body of work coming from his lab. |
||||||
|
||||||
Jain initially studied chemical engineering, and he approaches biological systems with quantitative questions and ingenious methods to obtain the answers. One example is illustrated on the left. Fluorescent material of known molecular weight (dextran labeled with fluorescein is often used) is infused IV into a rabbit. The interstitial fluid, e.g. near a capillary in a tumor transplanted into the ear, is observed with a fluorescent microscope. After a few minutes the fluorescent material has moved into the tissue, and you see a constant, e.g. green, field. A laser is turned on for a fraction of a second, and the dye in the path of the beam is bleached, leaving a clear circle. A few seconds later the circle has moved, allowing you to measure the fluid velocity. The diameter of the circle has increased, and this allows you to measure the effective diffusion coefficient in the tissue. |
||||||